
Why
- See the trend in your niche: exact CTR, CPC and CVR for each keyword and for all of them together.
- Spot changes in key metrics early and adapt fast.
- Stay on top of PPC: spend and CVR per main keyword, and big changes you can fix early.
- A/B tests: with weekly history per keyword, you can judge whether a new main image or listing change improved CTR and CVR. It's PPC data, so it's reliable.
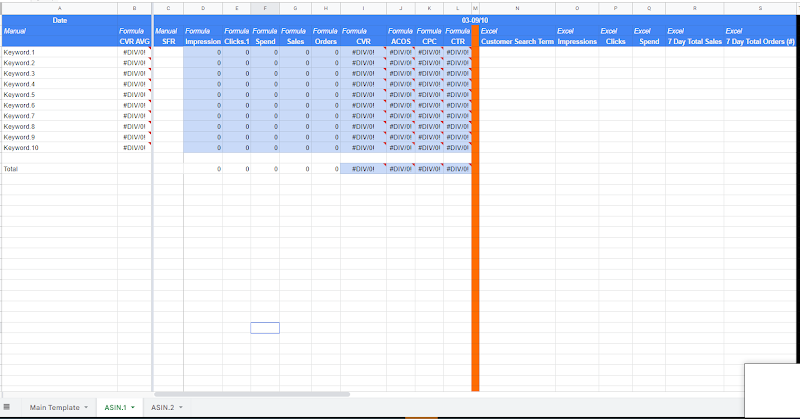
Fill it in at the same time as the weekly meeting: when you review the 80/20 products, open this report to see what happened on the main keywords in PPC and in the market.
Set up the sheet
- Download the template
Main keywords tracking ↓ (works in Excel and Google Sheets). Bookmark your copy.
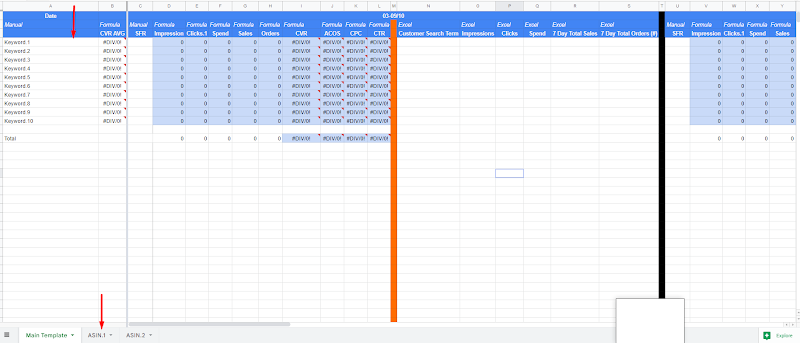
- Copy the Product template tab for each product
Rename it after the product.
- List the main keywords in column A
The biggest keywords you know are most relevant. Skip huge keywords your product doesn't do well on, and very small ones (beyond 750,000–1,000,000 SFR). 5 is enough; no more than 10.
- Fill in the last 4 weeks, then every week from now on
The weekly update
- Start the week's block
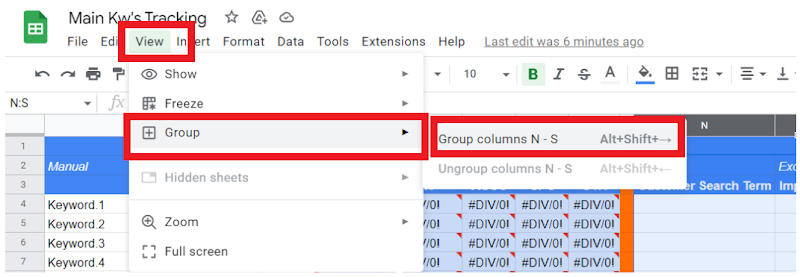
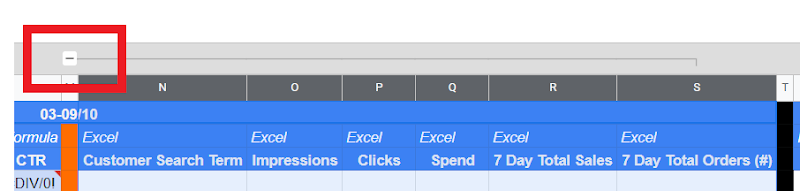
The template has six weekly blocks. For more, copy the last block to the right (SFR column through 7 Day Total Orders), then group and hide old weeks (View → Group). Clear the SFR and pasted data in the new block, but keep the blue formula columns.
- Download the Sponsored Products search term report
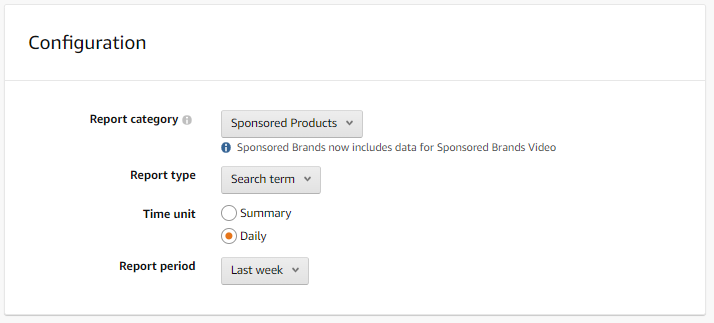
Measurement & Reporting → Create report → Sponsored Products, Search term, Daily, last week → Run report.
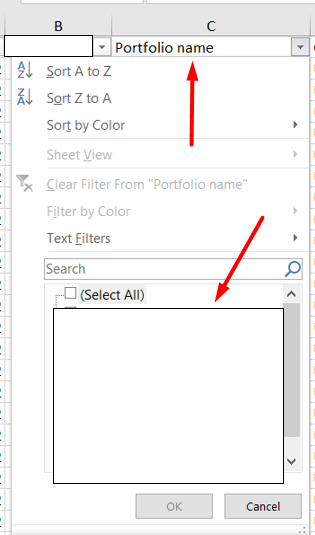
- Filter the portfolio to this product
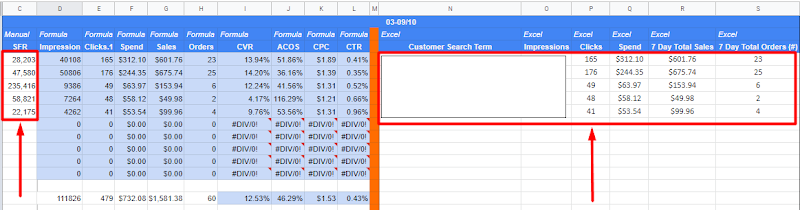
- Paste the columns in order
Customer Search Term → Impressions → Clicks → Spend → 7 Day Total Sales → 7 Day Total Orders (#). Follow the headers in row 3.
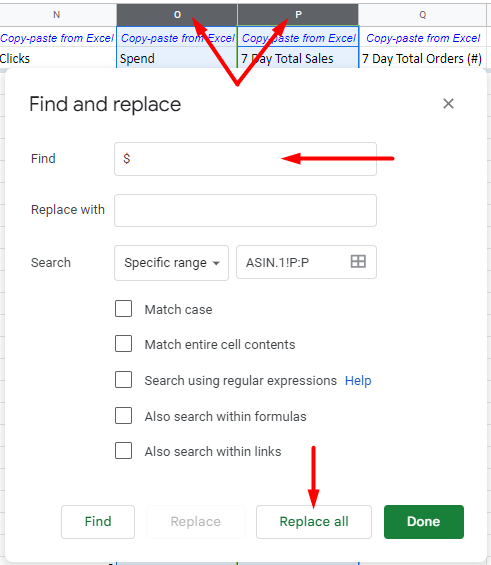
- Remove the $ signs from Spend and Sales
Select the columns → Ctrl+H → find "$" → Replace all.
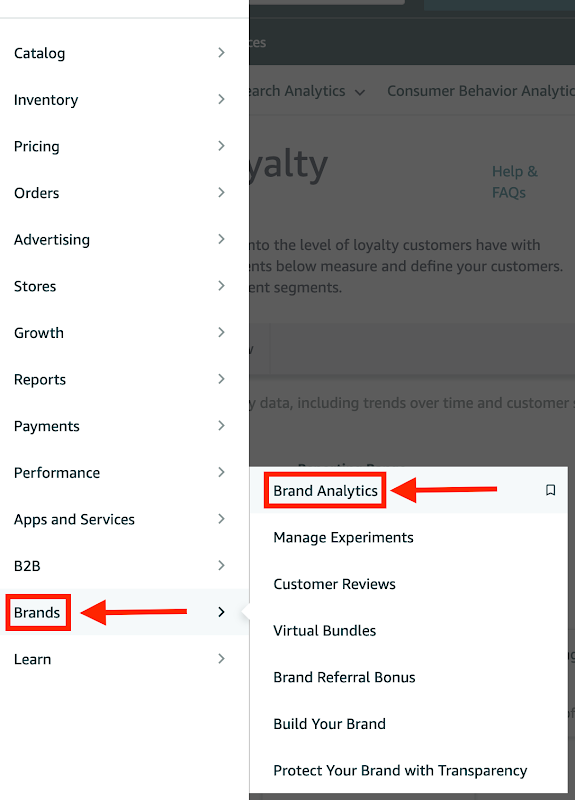
- Fill in each keyword's SFR
Brands → Brand Analytics → Top Search Terms, last week, one keyword at a time.
- Repeat for every product you track


Related guides
- Amazon keywords and competitors researchPick your 5 to 8 direct competitors, pull every keyword they win from Brand Analytics and Cerebro, find the soft competitors, then add…
- The weekly business reviewOne table of the numbers that matter, compared week over week, plus a short meeting that ends in owned actions.