Amz Consultors logo Amz Consultors Book a free strategy call

Case study · Amazon PPC · US brand

We stopped chasing rank. Margin went from 10% to 17%.

An 8-figure US brand spent 5% more on ads, made 33% more ad sales and lifted its contribution margin from 9.8% to 16.6%. The change: we stopped buying rankings and started buying profitable traffic.

9.8% → 16.6%

Contribution margin, Q3 2024 vs Q3 2026

+33%

Ad sales on 5% more ad spend, US, Q3 2024 vs Q3 2026

+41%

Organic units, Q3 2026 vs Q3 2025

$8.2M

Revenue January to September 2026, up 26% on the same months of 2025

The starting point: rank at any cost

For years the strategy was the familiar one: chase page-one rankings with aggressive exact match bids, heavy advertising and competitive pricing. Most of the ad spend went on exact match rank bids.

The problem was that it kept getting more expensive. Through 2024, ACoS kept climbing and margin kept falling, and the rankings the money bought never lasted.

So we changed the question from "how do we rank higher?" to "which keywords, match types, audiences and products actually make money?"

What we changed

1. We rebuilt PPC around efficiency

We cut back exact match rank bids and stopped generic rank bids altogether. At the same time we scaled automatic campaigns, whose clicks cost about half what exact match clicks cost, and improved broad and phrase match performance.

  • Exact match rank bids fell from 58% to 30% of ad spend (Q3 2024 to Q3 2026).
  • Automatic campaigns grew from 3% to 25% of ad spend over the same period.
  • Average cost per click fell from $1.78 to $1.46, and ACoS from 34.5% to 28.0%.
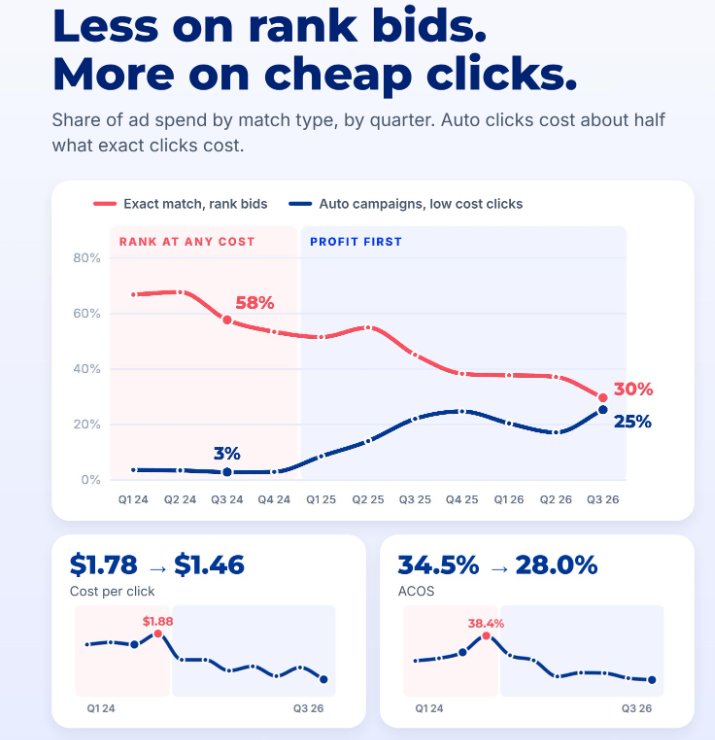
Line chart of the share of ad spend by match type from Q1 2024 to Q3 2026. Exact match rank bids fall from about two thirds of spend to 30%, while automatic campaigns rise from 3% to 25%. Cost per click falls from $1.78 to $1.46 and ACoS from 34.5% to 28.0%.
Share of ad spend by match type, by quarter, with cost per click and ACoS.

2. We grew the number of search terms that sell

Instead of leaning on a handful of expensive generic keywords, we went after the many relevant searches shoppers actually use.

  • Search terms that turned into orders went from 3,938 to 8,311 per quarter, a 2.1x increase (Q3 2024 to Q3 2026).
  • On the ten biggest search terms, cost per click fell from $2.34 to $1.96 and ACoS from 40.9% to 29.4%.
  • In the US, July to September, ad spend rose 5% while ad sales rose 33% (2024 against 2026).
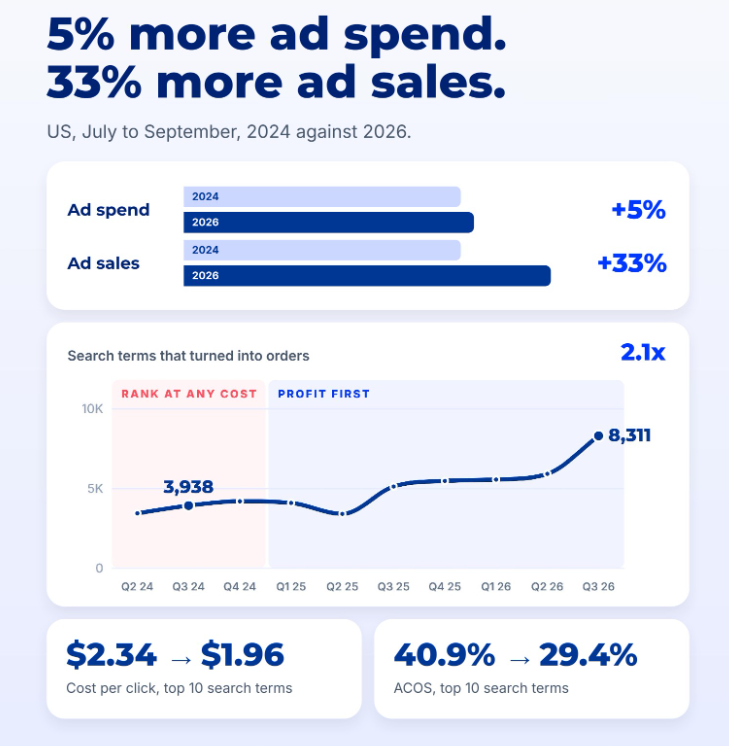
Bar chart showing US ad spend up 5% and ad sales up 33% for July to September 2026 against 2024, and a line chart of search terms that turned into orders rising from 3,938 in Q3 2024 to 8,311 in Q3 2026.
Ad spend against ad sales, and search terms that turned into orders, by quarter.

3. We leaned into Amazon's inbuilt audiences

Amazon lets you adjust bids for shoppers in its own audience segments. In the same campaigns over the same days, July to September 2026, shoppers in those audiences performed far better than shoppers in none:

MetricNo audienceInbuilt audiencesLift
Conversion rate13.3%23.0%1.7x
Click-through rate0.45%0.91%2.0x
ACoS31%24%−7 pts
ROAS3.2x4.2x1.3x

Audience clicks cost about 40% more, and still returned about 30% more per ad dollar. Inbuilt audiences beat no audience in every month from March to September 2026, so we moved budget towards them: from 4% of ad spend in March to 43% in September, when they produced 48% of ad sales.
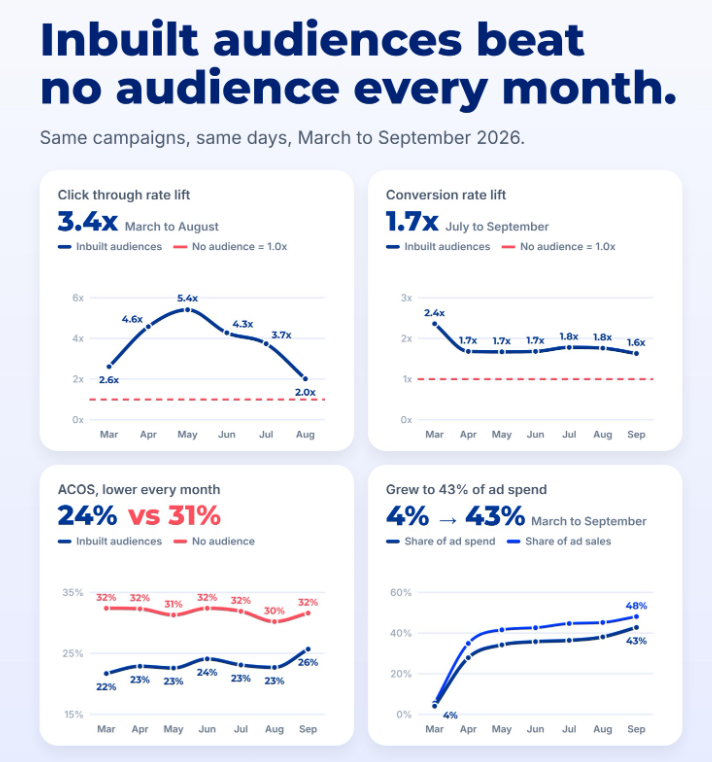
Four small charts for March to September 2026 comparing inbuilt audiences with no audience: click-through rate lift, conversion rate lift of about 1.7x, ACoS of 22 to 26% against 30 to 32%, and audience share of ad spend growing from 4% to 43%.
Inbuilt audiences against no audience, month by month.

4. Outside the ads: price, pack and market

PPC was not the only driver, and it rarely is. Advertising efficiency turned into profit because the rest of the business moved with it:

  • We raised the price of the core product line and launched new pack sizes, which lifted revenue per unit.
  • Listings were optimised so the extra traffic converted.
  • The brand expanded into the EU, where Germany outperformed both Canada and the UK.

The results

  • Revenue reached $8.2M from January to September 2026, 26% more than the same period of 2025.
  • Q3 2026 revenue was $3.3M, the brand's strongest quarter since 2022.
  • Contribution margin rose to 16.6% in Q3 2026, from 12.7% a year earlier and 9.8% two years earlier.
  • Every month from January to September 2026 beat the same month of 2025, in both revenue and organic units.
  • Organic units grew 41% from July to September, compared with 2025. Less money spent buying rank, and more sales arriving without it.
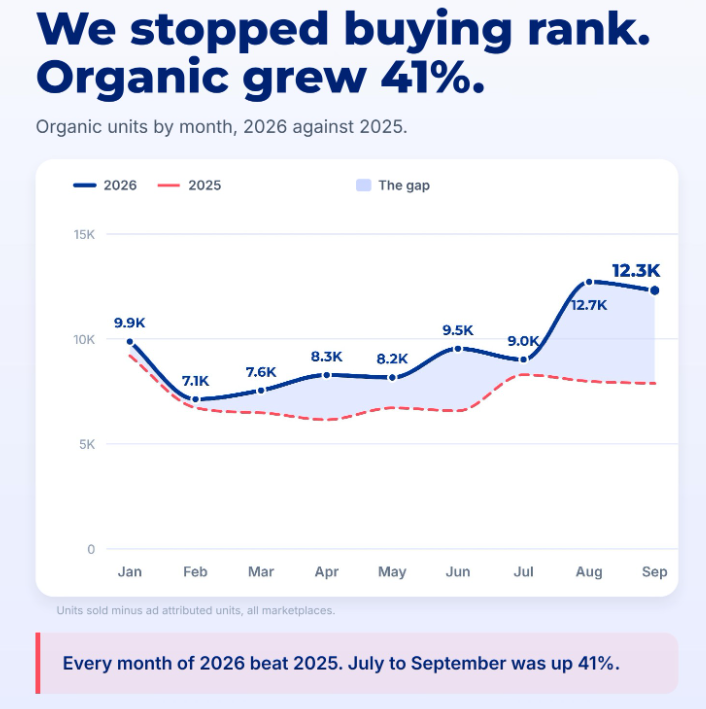
Line chart of organic units by month, January to September, 2026 against 2025. 2026 is above 2025 every month and reaches 12,700 in August and 12,300 in September, against about 8,000 a month in the same months of 2025.
Organic units by month, 2026 against 2025. Organic units are units sold minus ad-attributed units, across all marketplaces.

The takeaway

Spending more on exact match to win top-of-search is no longer a strategy on its own. Growth that lasts comes from knowing which keywords, match types, audiences and products generate profit, and moving money to them every week.

We call this multi-signal advertising: managing ads against margin, organic sales and conversion together, instead of against a single metric like ACoS or rank.

Brand name withheld for confidentiality. Figures come from the brand's Amazon sales and advertising data for the periods stated. Results depend on category, margins and starting point.

Want this on your account?

Free audit. You keep the findings either way. We review your campaign structure, keyword strategy and search terms, then walk you through a growth plan.

Get my free audit Book a strategy call →

← All case studies

Case Study: Margin From 10% to 17% With Profit-First Amazon PPC — Amz Consultors
Amz Consultors logo Amz Consultors Book a free strategy call
{{ t.label }}

Case study · Amazon PPC · US brand

We stopped chasing rank. Margin went from 10% to 17%.

An 8-figure US brand spent 5% more on ads, made 33% more ad sales and lifted its contribution margin from 9.8% to 16.6%. The change: we stopped buying rankings and started buying profitable traffic.

9.8% → 16.6%

Contribution margin, Q3 2024 vs Q3 2026

+33%

Ad sales on 5% more ad spend, US, Q3 2024 vs Q3 2026

+41%

Organic units, Q3 2026 vs Q3 2025

$8.2M

Revenue January to September 2026, up 26% on the same months of 2025

The starting point: rank at any cost

For years the strategy was the familiar one: chase page-one rankings with aggressive exact match bids, heavy advertising and competitive pricing. Most of the ad spend went on exact match rank bids.

The problem was that it kept getting more expensive. Through 2024, ACoS kept climbing and margin kept falling, and the rankings the money bought never lasted.

So we changed the question from "how do we rank higher?" to "which keywords, match types, audiences and products actually make money?"

What we changed

1. We rebuilt PPC around efficiency

We cut back exact match rank bids and stopped generic rank bids altogether. At the same time we scaled automatic campaigns, whose clicks cost about half what exact match clicks cost, and improved broad and phrase match performance.

  • Exact match rank bids fell from 58% to 30% of ad spend (Q3 2024 to Q3 2026).
  • Automatic campaigns grew from 3% to 25% of ad spend over the same period.
  • Average cost per click fell from $1.78 to $1.46, and ACoS from 34.5% to 28.0%.
Line chart of the share of ad spend by match type from Q1 2024 to Q3 2026. Exact match rank bids fall from about two thirds of spend to 30%, while automatic campaigns rise from 3% to 25%. Cost per click falls from $1.78 to $1.46 and ACoS from 34.5% to 28.0%.
Share of ad spend by match type, by quarter, with cost per click and ACoS.

2. We grew the number of search terms that sell

Instead of leaning on a handful of expensive generic keywords, we went after the many relevant searches shoppers actually use.

  • Search terms that turned into orders went from 3,938 to 8,311 per quarter, a 2.1x increase (Q3 2024 to Q3 2026).
  • On the ten biggest search terms, cost per click fell from $2.34 to $1.96 and ACoS from 40.9% to 29.4%.
  • In the US, July to September, ad spend rose 5% while ad sales rose 33% (2024 against 2026).
Bar chart showing US ad spend up 5% and ad sales up 33% for July to September 2026 against 2024, and a line chart of search terms that turned into orders rising from 3,938 in Q3 2024 to 8,311 in Q3 2026.
Ad spend against ad sales, and search terms that turned into orders, by quarter.

3. We leaned into Amazon's inbuilt audiences

Amazon lets you adjust bids for shoppers in its own audience segments. In the same campaigns over the same days, July to September 2026, shoppers in those audiences performed far better than shoppers in none:

MetricNo audienceInbuilt audiencesLift
Conversion rate13.3%23.0%1.7x
Click-through rate0.45%0.91%2.0x
ACoS31%24%−7 pts
ROAS3.2x4.2x1.3x

Audience clicks cost about 40% more, and still returned about 30% more per ad dollar. Inbuilt audiences beat no audience in every month from March to September 2026, so we moved budget towards them: from 4% of ad spend in March to 43% in September, when they produced 48% of ad sales.

Four small charts for March to September 2026 comparing inbuilt audiences with no audience: click-through rate lift, conversion rate lift of about 1.7x, ACoS of 22 to 26% against 30 to 32%, and audience share of ad spend growing from 4% to 43%.
Inbuilt audiences against no audience, month by month.

4. Outside the ads: price, pack and market

PPC was not the only driver, and it rarely is. Advertising efficiency turned into profit because the rest of the business moved with it:

  • We raised the price of the core product line and launched new pack sizes, which lifted revenue per unit.
  • Listings were optimised so the extra traffic converted.
  • The brand expanded into the EU, where Germany outperformed both Canada and the UK.

The results

  • Revenue reached $8.2M from January to September 2026, 26% more than the same period of 2025.
  • Q3 2026 revenue was $3.3M, the brand's strongest quarter since 2022.
  • Contribution margin rose to 16.6% in Q3 2026, from 12.7% a year earlier and 9.8% two years earlier.
  • Every month from January to September 2026 beat the same month of 2025, in both revenue and organic units.
  • Organic units grew 41% from July to September, compared with 2025. Less money spent buying rank, and more sales arriving without it.
Line chart of organic units by month, January to September, 2026 against 2025. 2026 is above 2025 every month and reaches 12,700 in August and 12,300 in September, against about 8,000 a month in the same months of 2025.
Organic units by month, 2026 against 2025. Organic units are units sold minus ad-attributed units, across all marketplaces.

The takeaway

Spending more on exact match to win top-of-search is no longer a strategy on its own. Growth that lasts comes from knowing which keywords, match types, audiences and products generate profit, and moving money to them every week.

We call this multi-signal advertising: managing ads against margin, organic sales and conversion together, instead of against a single metric like ACoS or rank.

Brand name withheld for confidentiality. Figures come from the brand's Amazon sales and advertising data for the periods stated. Results depend on category, margins and starting point.

Want this on your account?

Free audit. You keep the findings either way. We review your campaign structure, keyword strategy and search terms, then walk you through a growth plan.

Get my free audit Book a strategy call →

← All case studies